Introduction
The Shoparize Performance Dashboard brings together your performance data, Google Shopping insights and sales forecasts across three pages: Performance Report, Insights and Forecasting Tool. This guide shows you how to get access and use each page.
Before you start
- Active Managed Ads with Shoparize, as an affiliate or direct partner
- Dashboard access activated by your partnership manager or support manager
- At least 90 days of Managed Ads data to use the forecast
Get access to your dashboard
- Ask your partnership manager or support manager to activate your dashboard. If you're an affiliate partner without a partnership manager, email affiliate@shoparize.com.
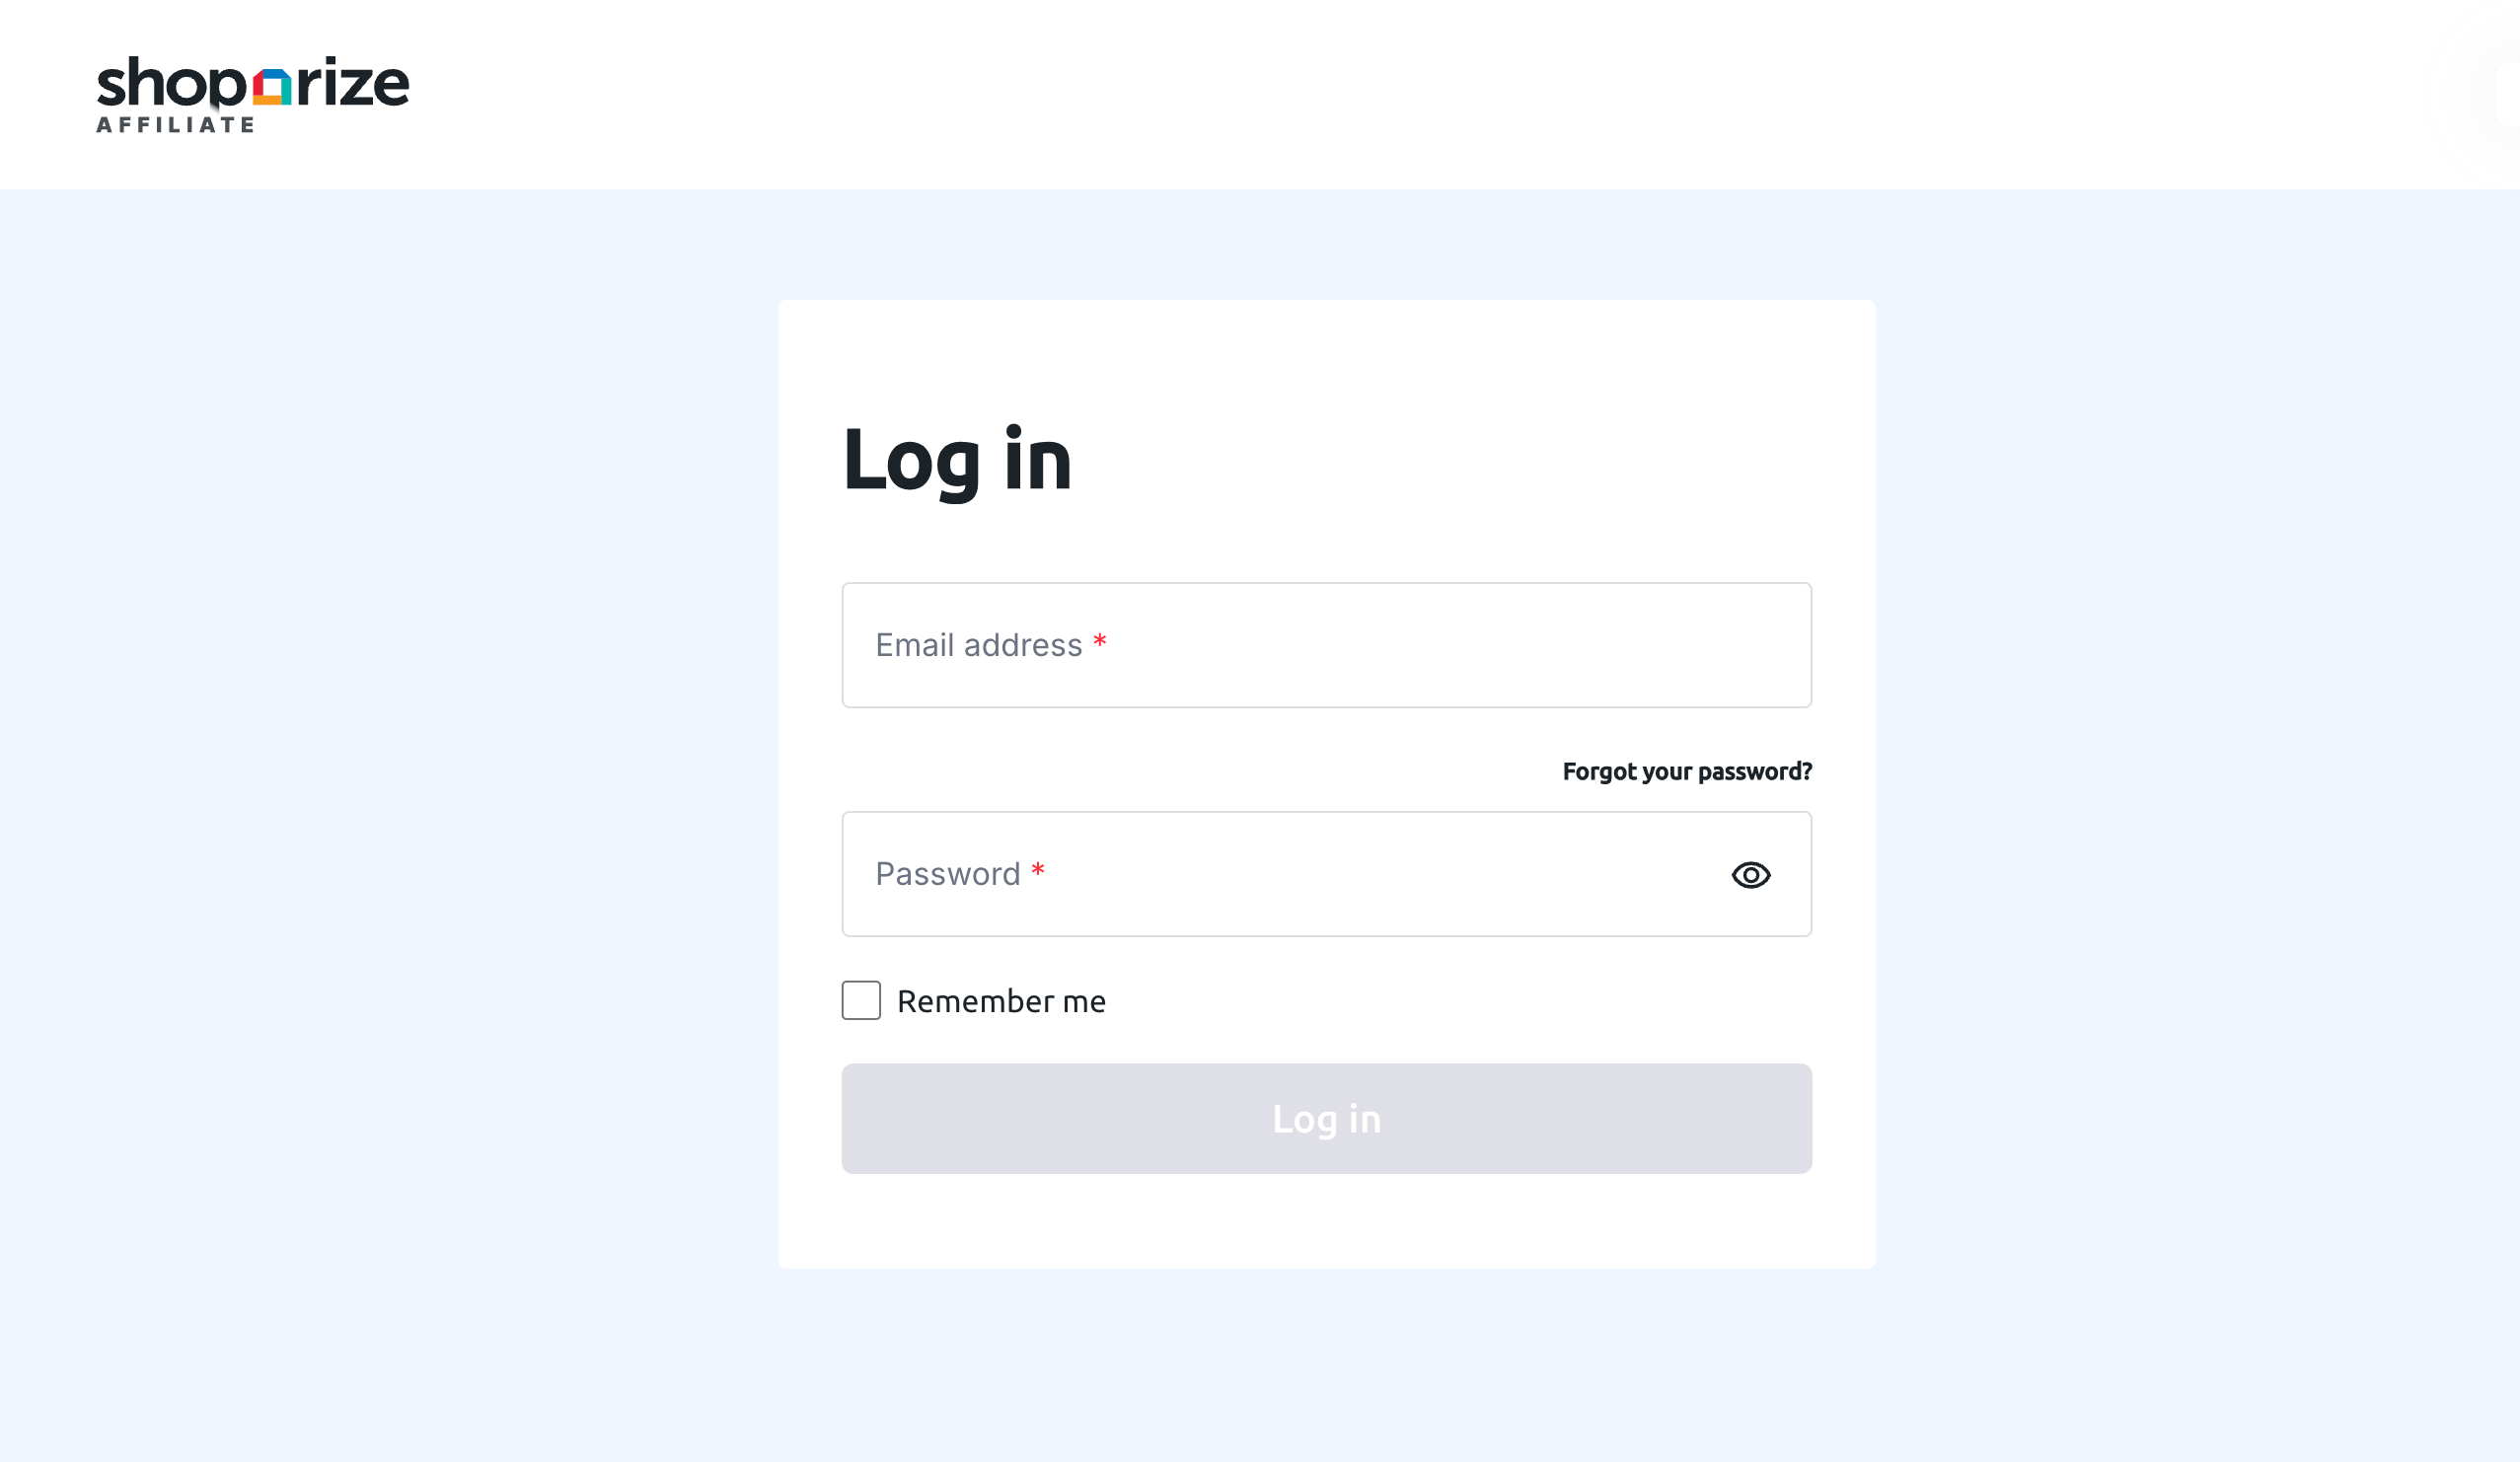
- Open the link you receive by email to sign in. If you have access to more than one shop or country, select the one you want to view at the top of the page.
Check your performance
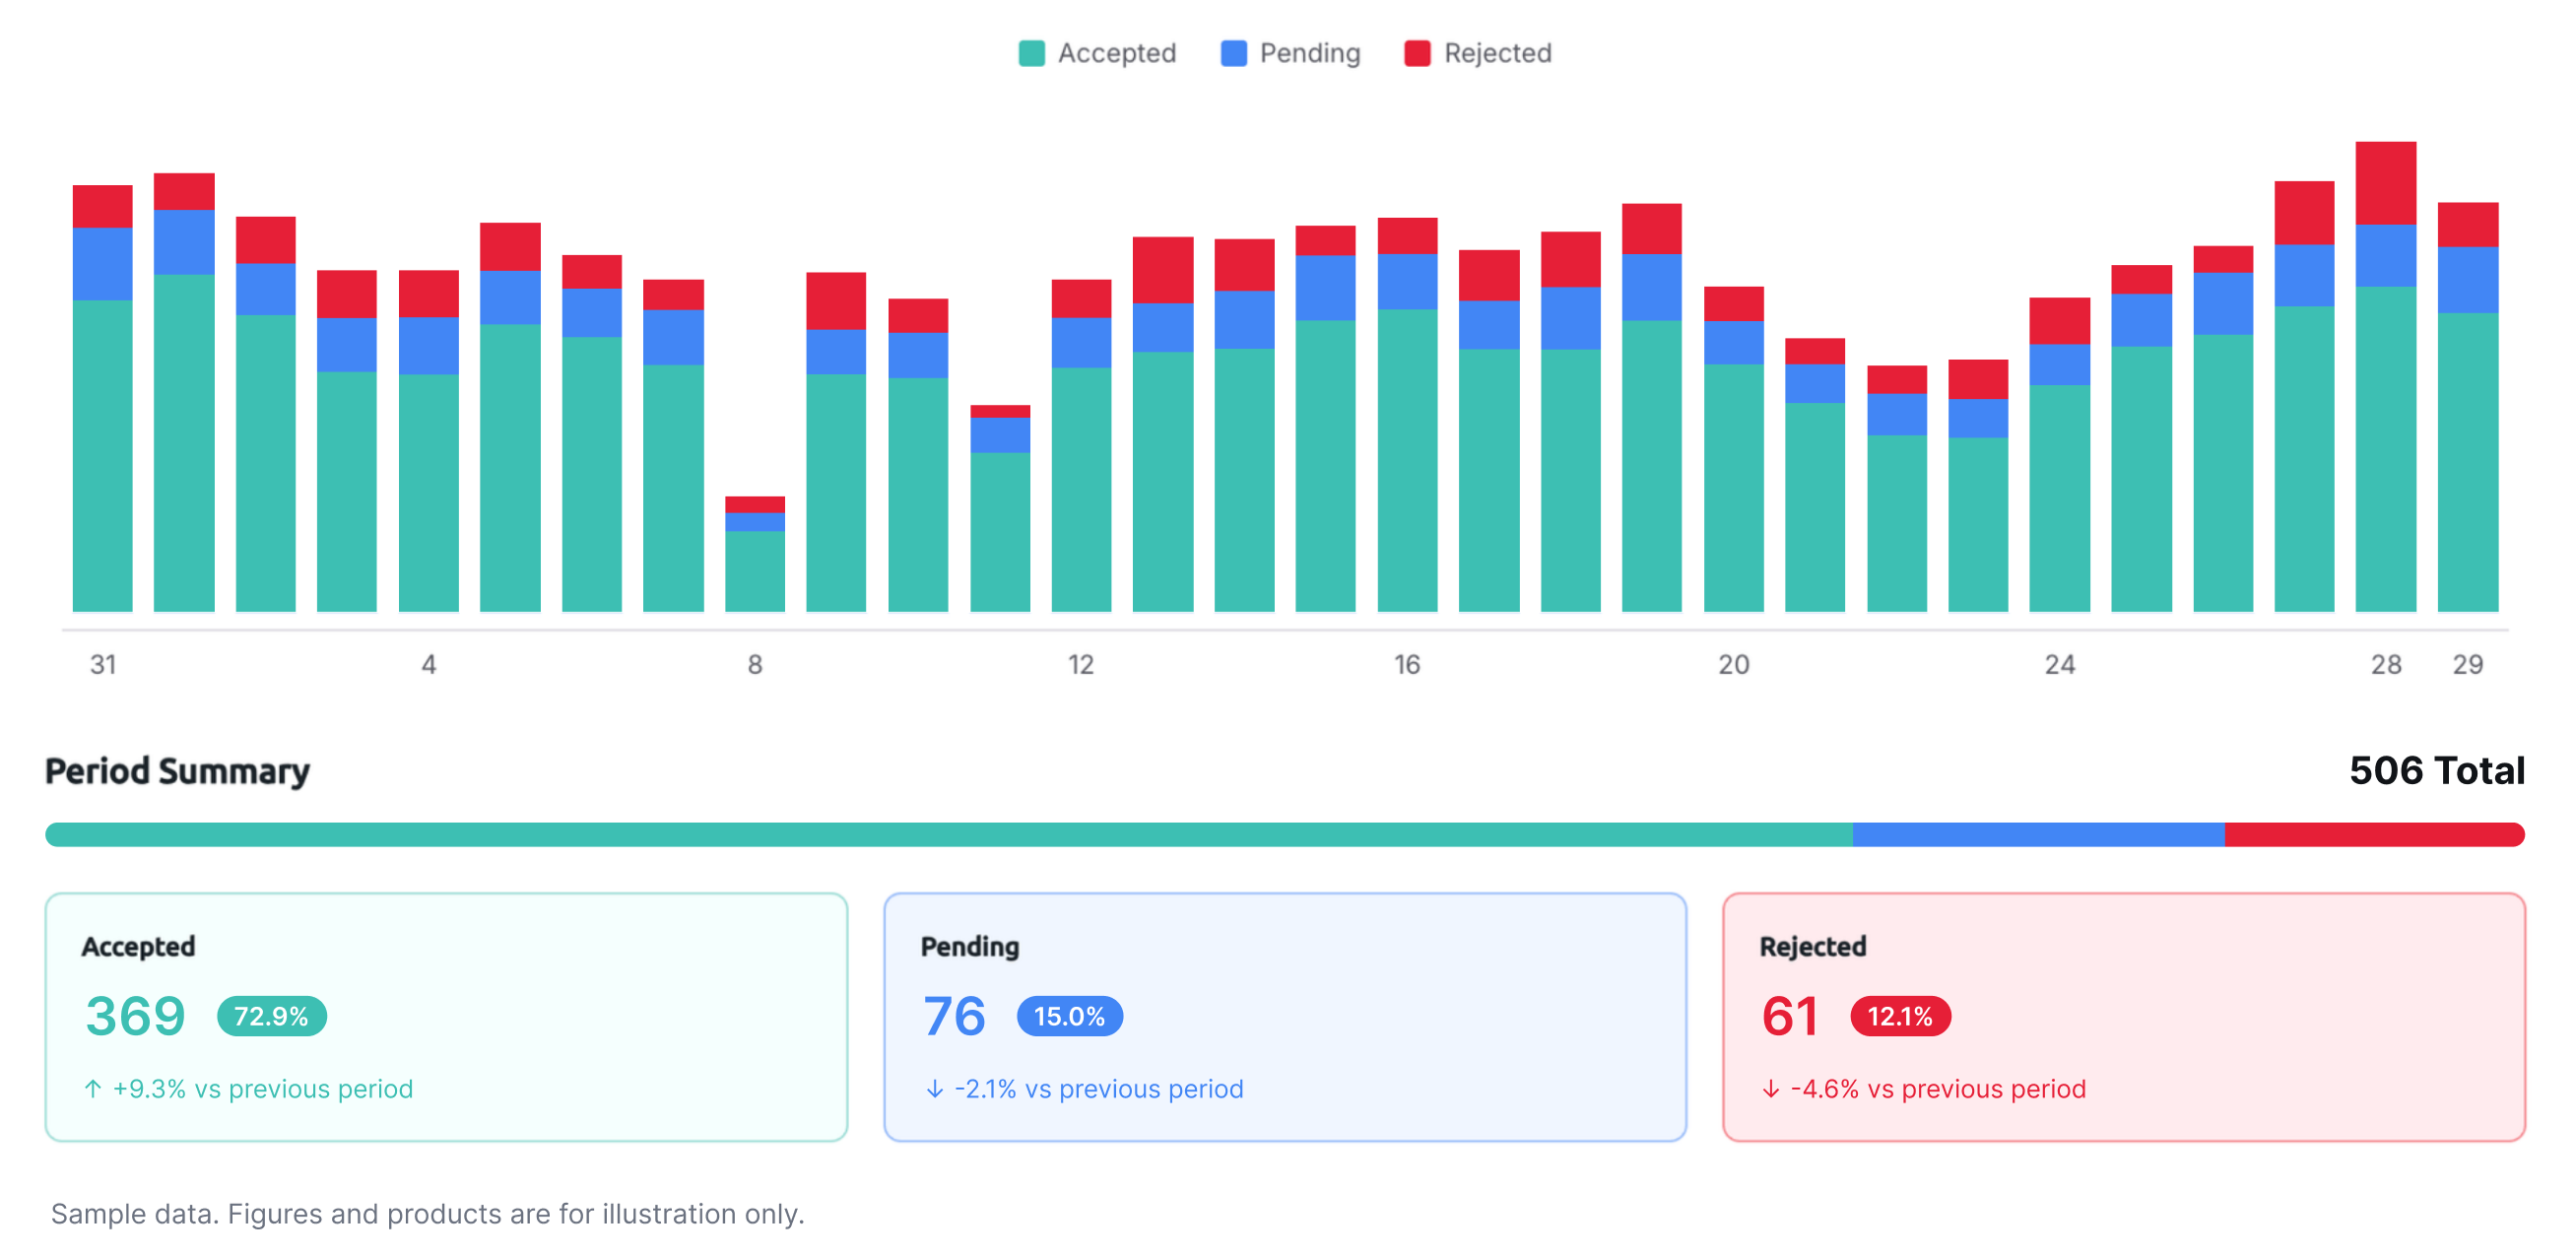
- Click Performance in the top menu.
- Select a source under Conversion source and a date range under Period.
- Scroll down to Period Summary to see your accepted, pending and rejected conversions.
Check your Google Shopping insights
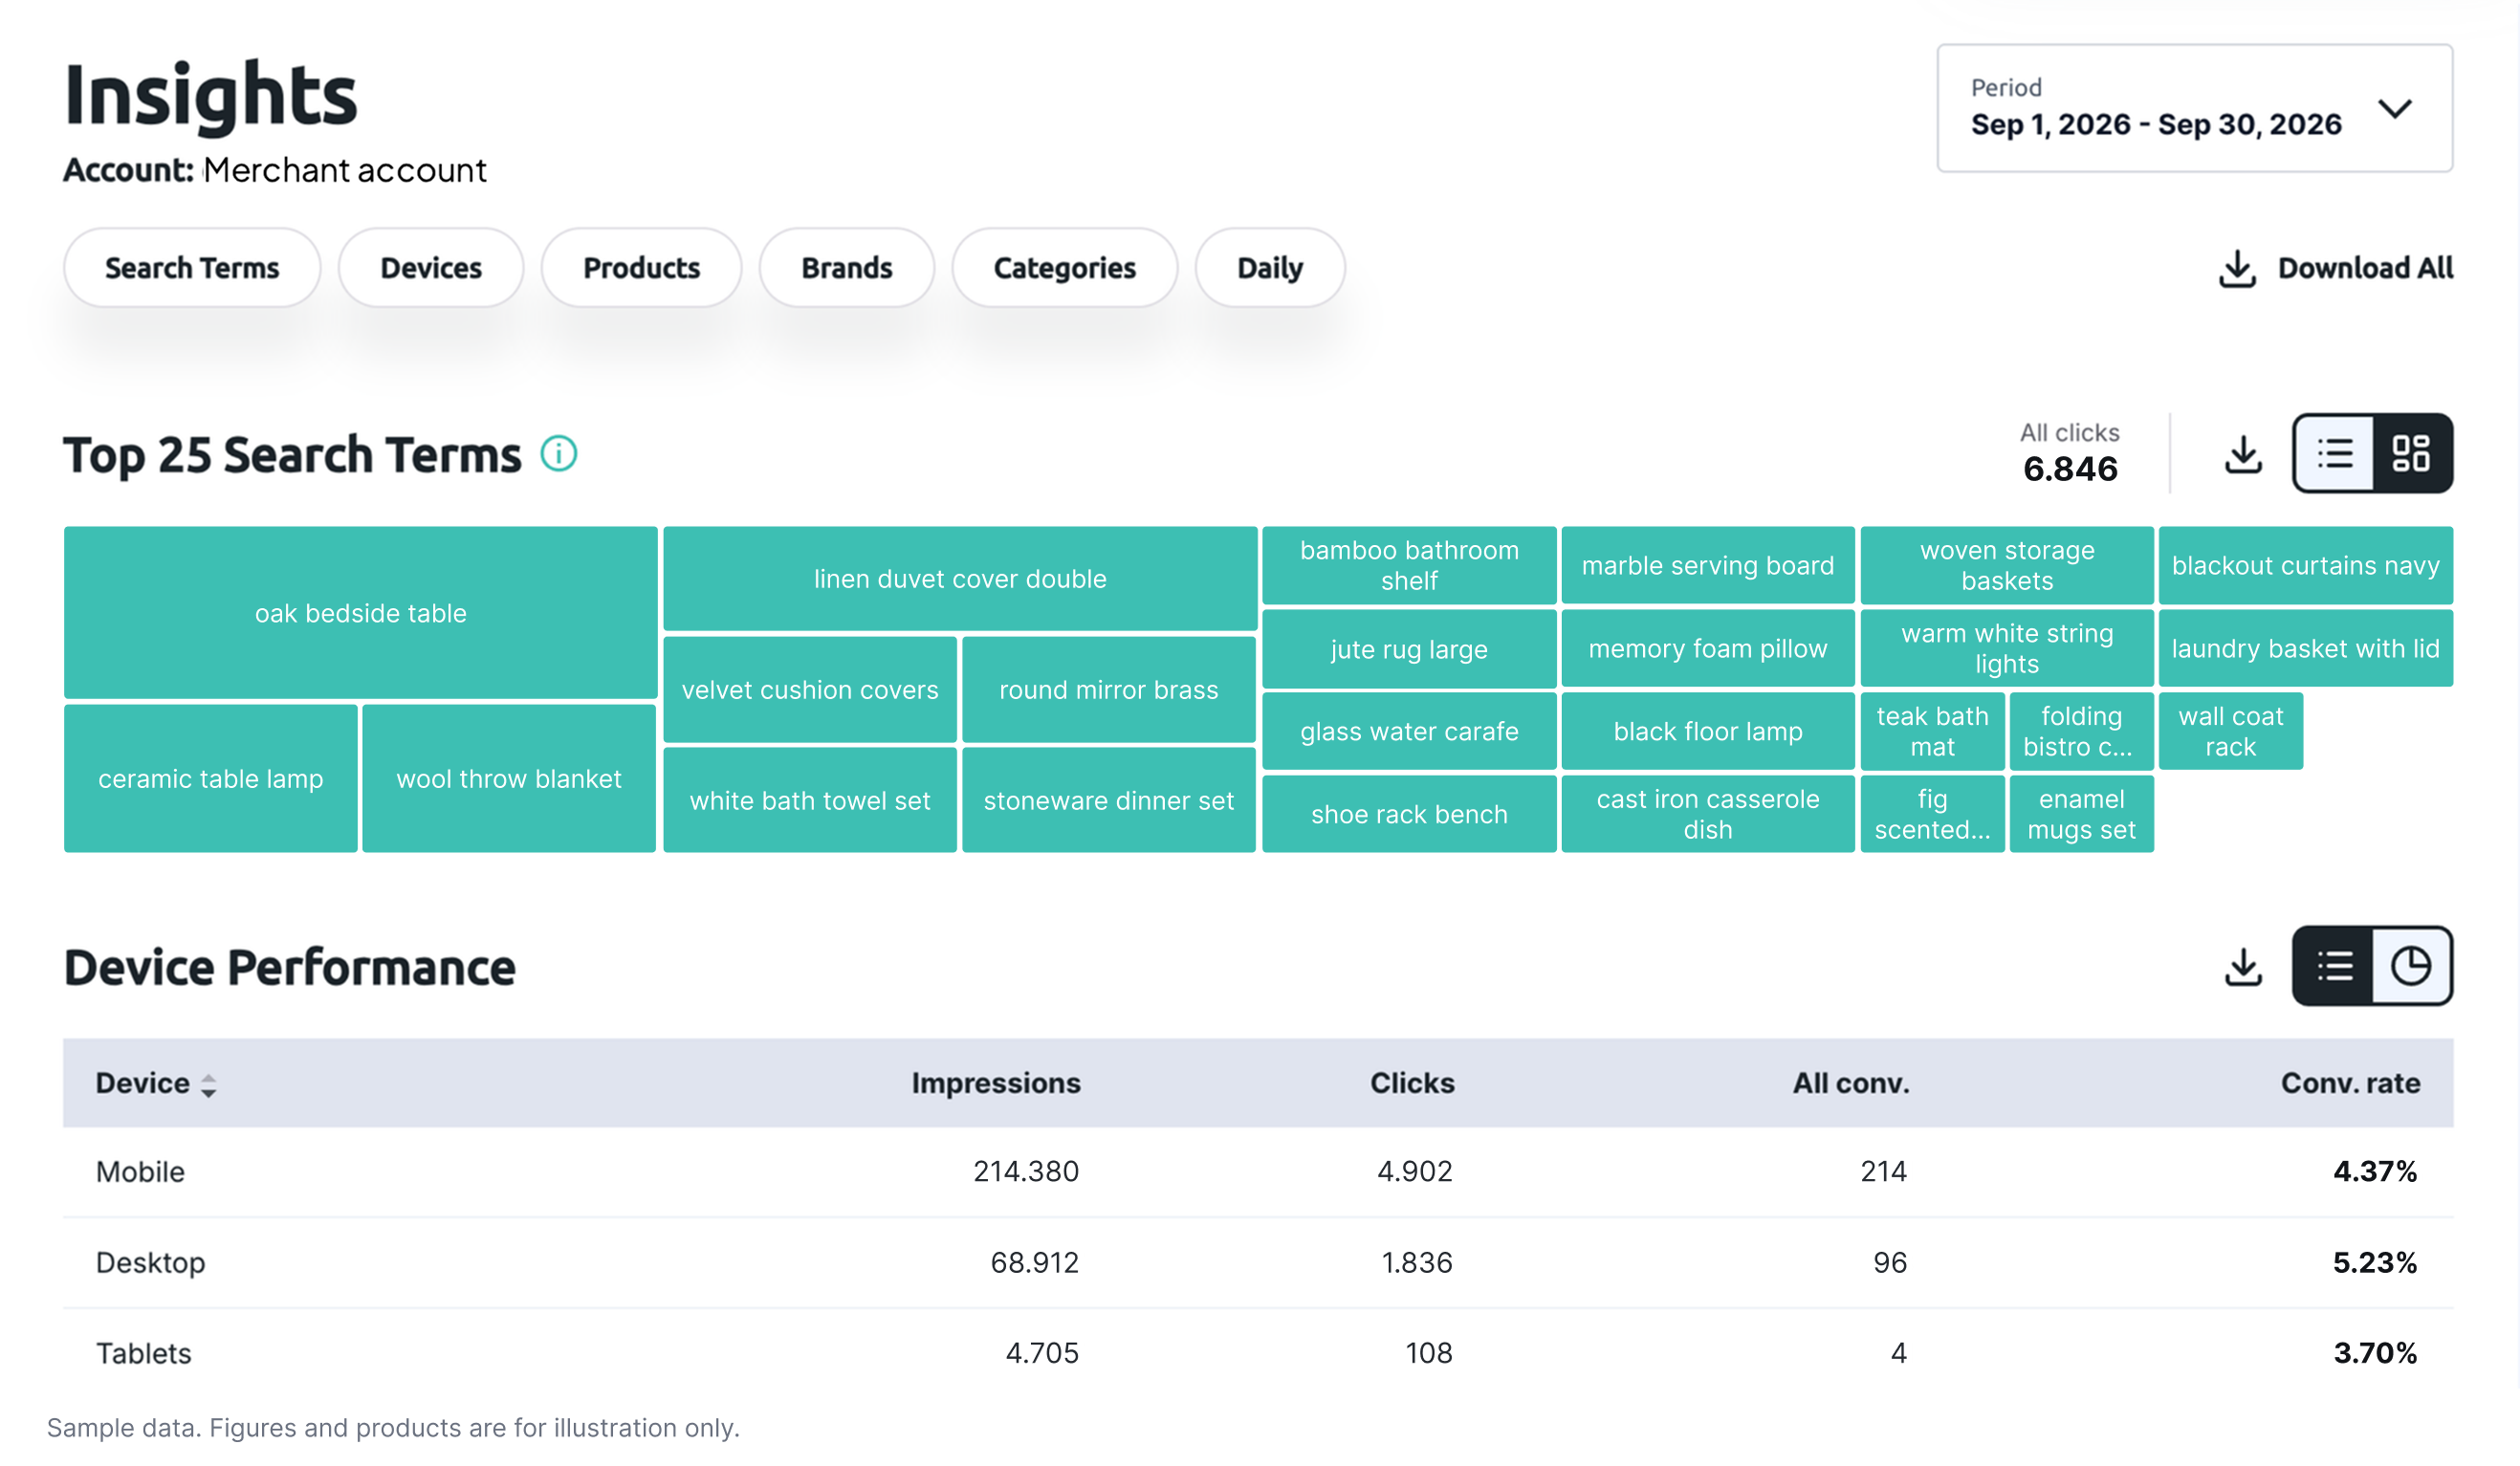
- Click Insights in the top menu. Insights use Google Shopping data only.
- Select Search Terms, Devices, Products, Brands, Categories or Daily.
- Click Download All to export every section, or click the download icon on a section to export only that one.
Run a forecast
- Click Forecast in the top menu.
- Select a Seasonality that matches your sales period, and a Time Range.
- Drag the Effective Commission handle to see how a change in commission affects your projected impressions, clicks, orders and revenue.
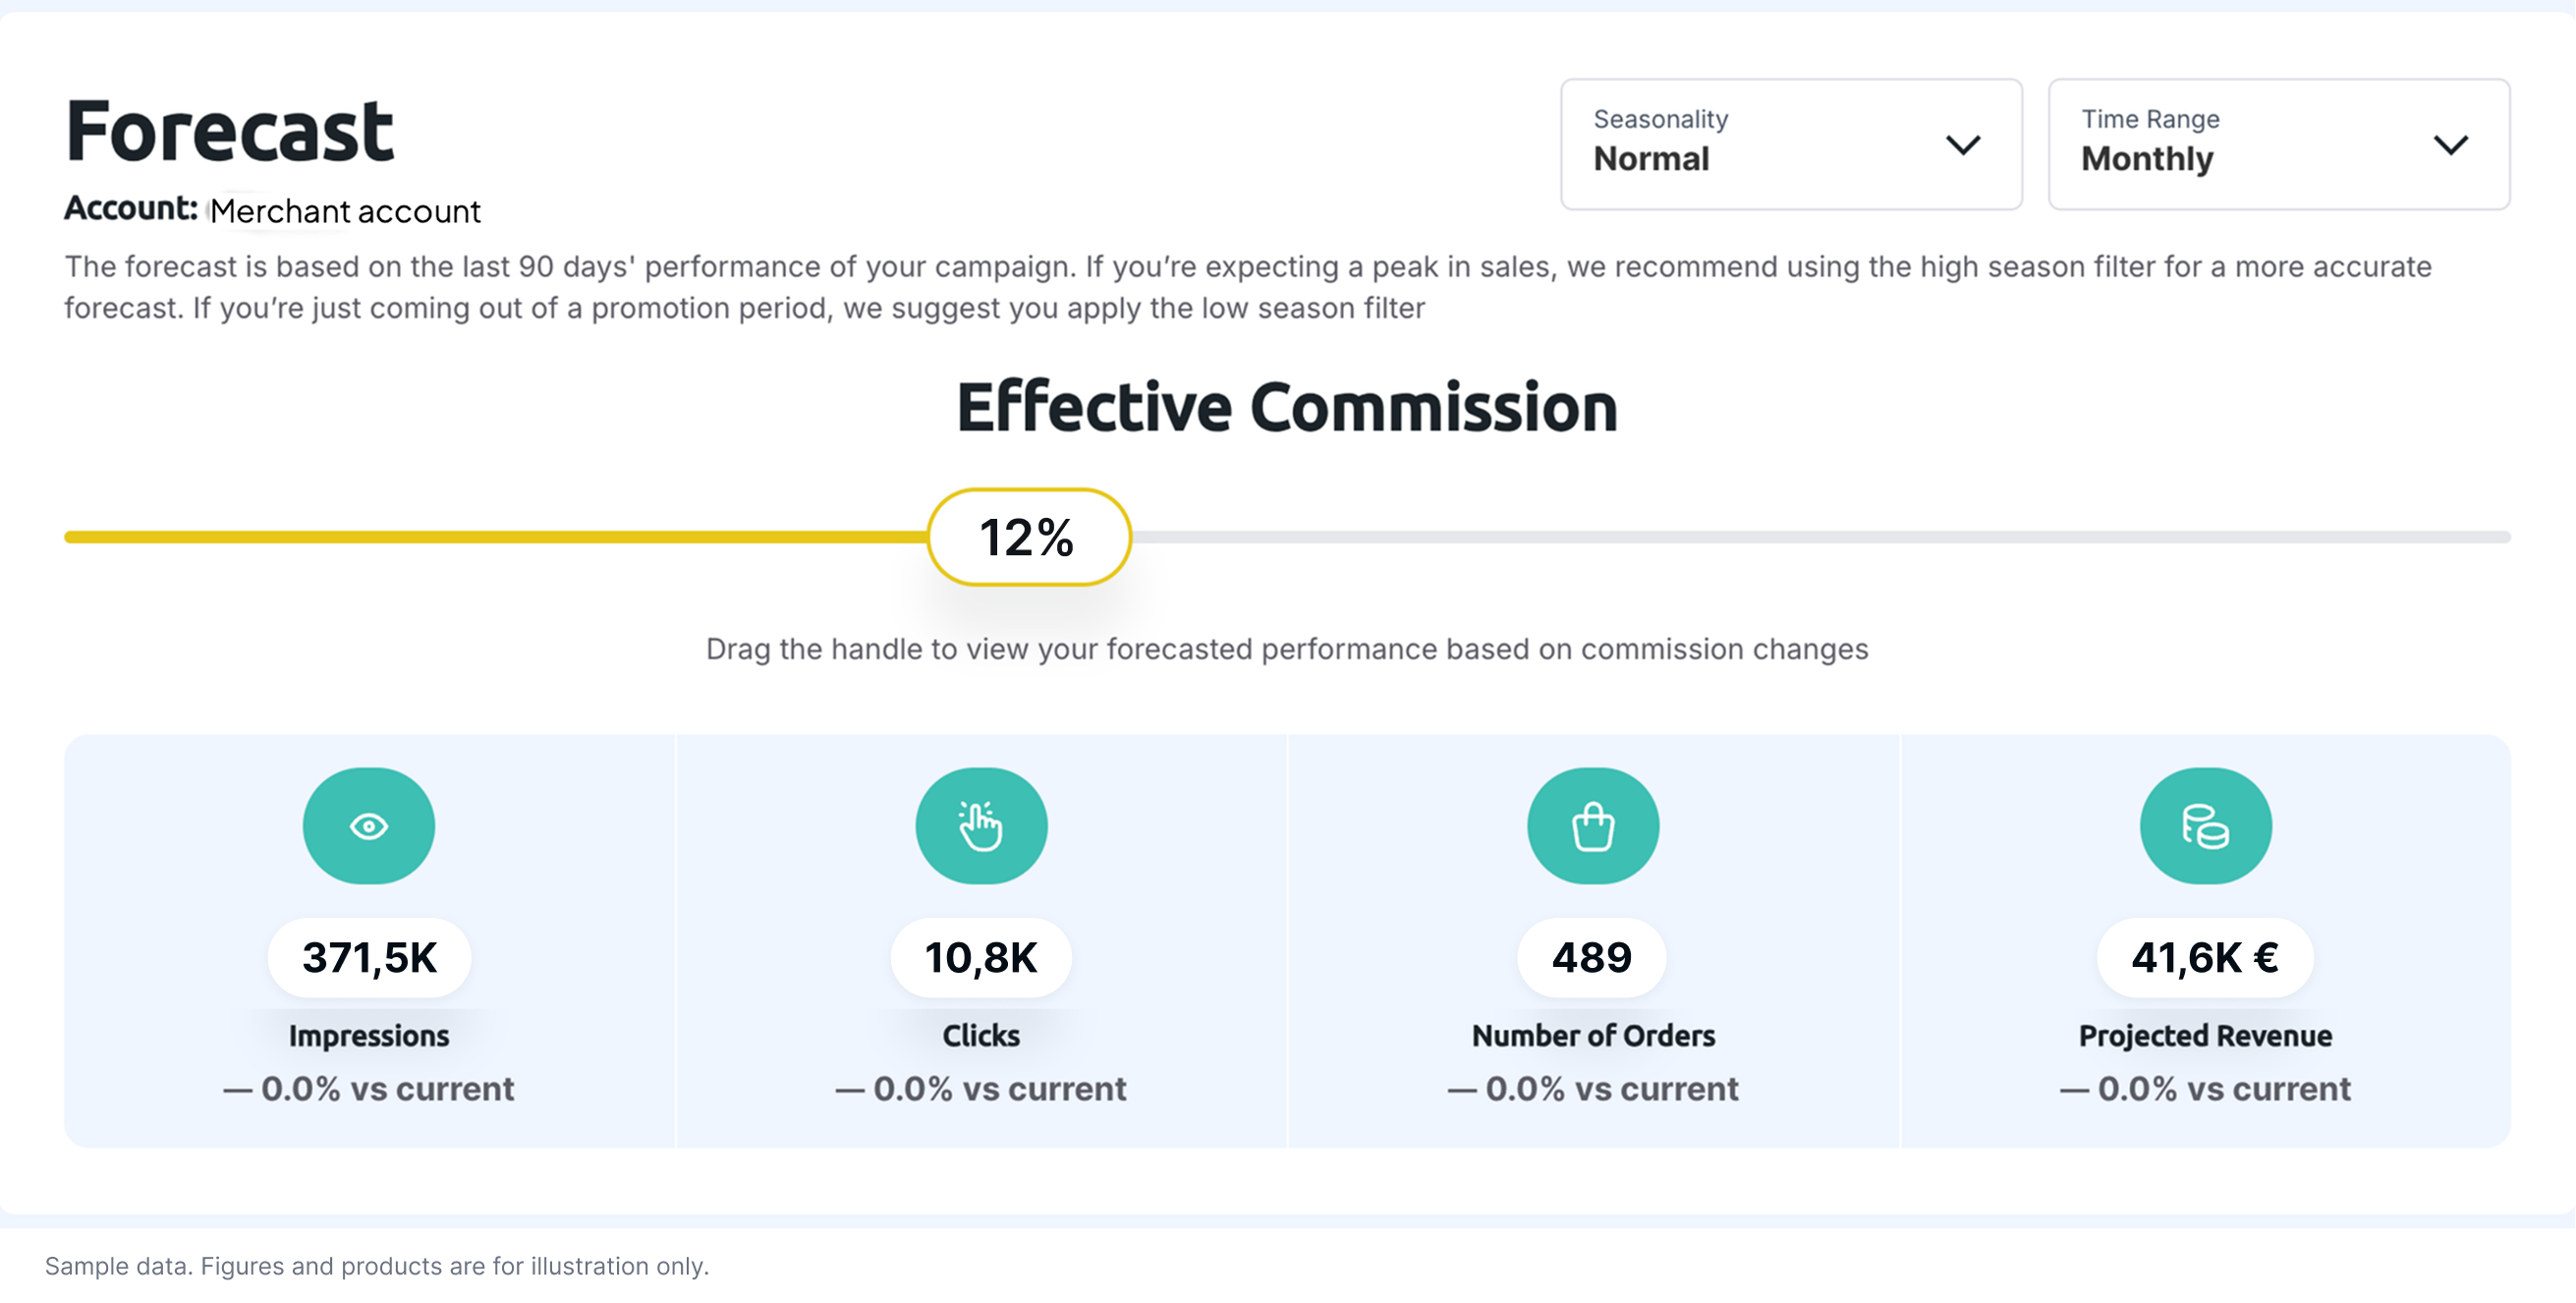
Forecasts use Google Shopping data and are estimates, not a guarantee of future performance.