Introduction
If you run Managed Ads with Shoparize, you can request access to the new Shoparize Performance Dashboard ahead of Black Friday (27 November). The dashboard brings together your performance data, Google Shopping insights and sales forecasts across three pages: Performance Report, Insights and Forecasting Tool. For step-by-step instructions, see How to use the Shoparize Performance Dashboard.
Ask your partnership manager or support manager to activate your dashboard. If you work with Shoparize Managed Ads via an affiliate network, but don’t have a partnership manager, email affiliate@shoparize.com.
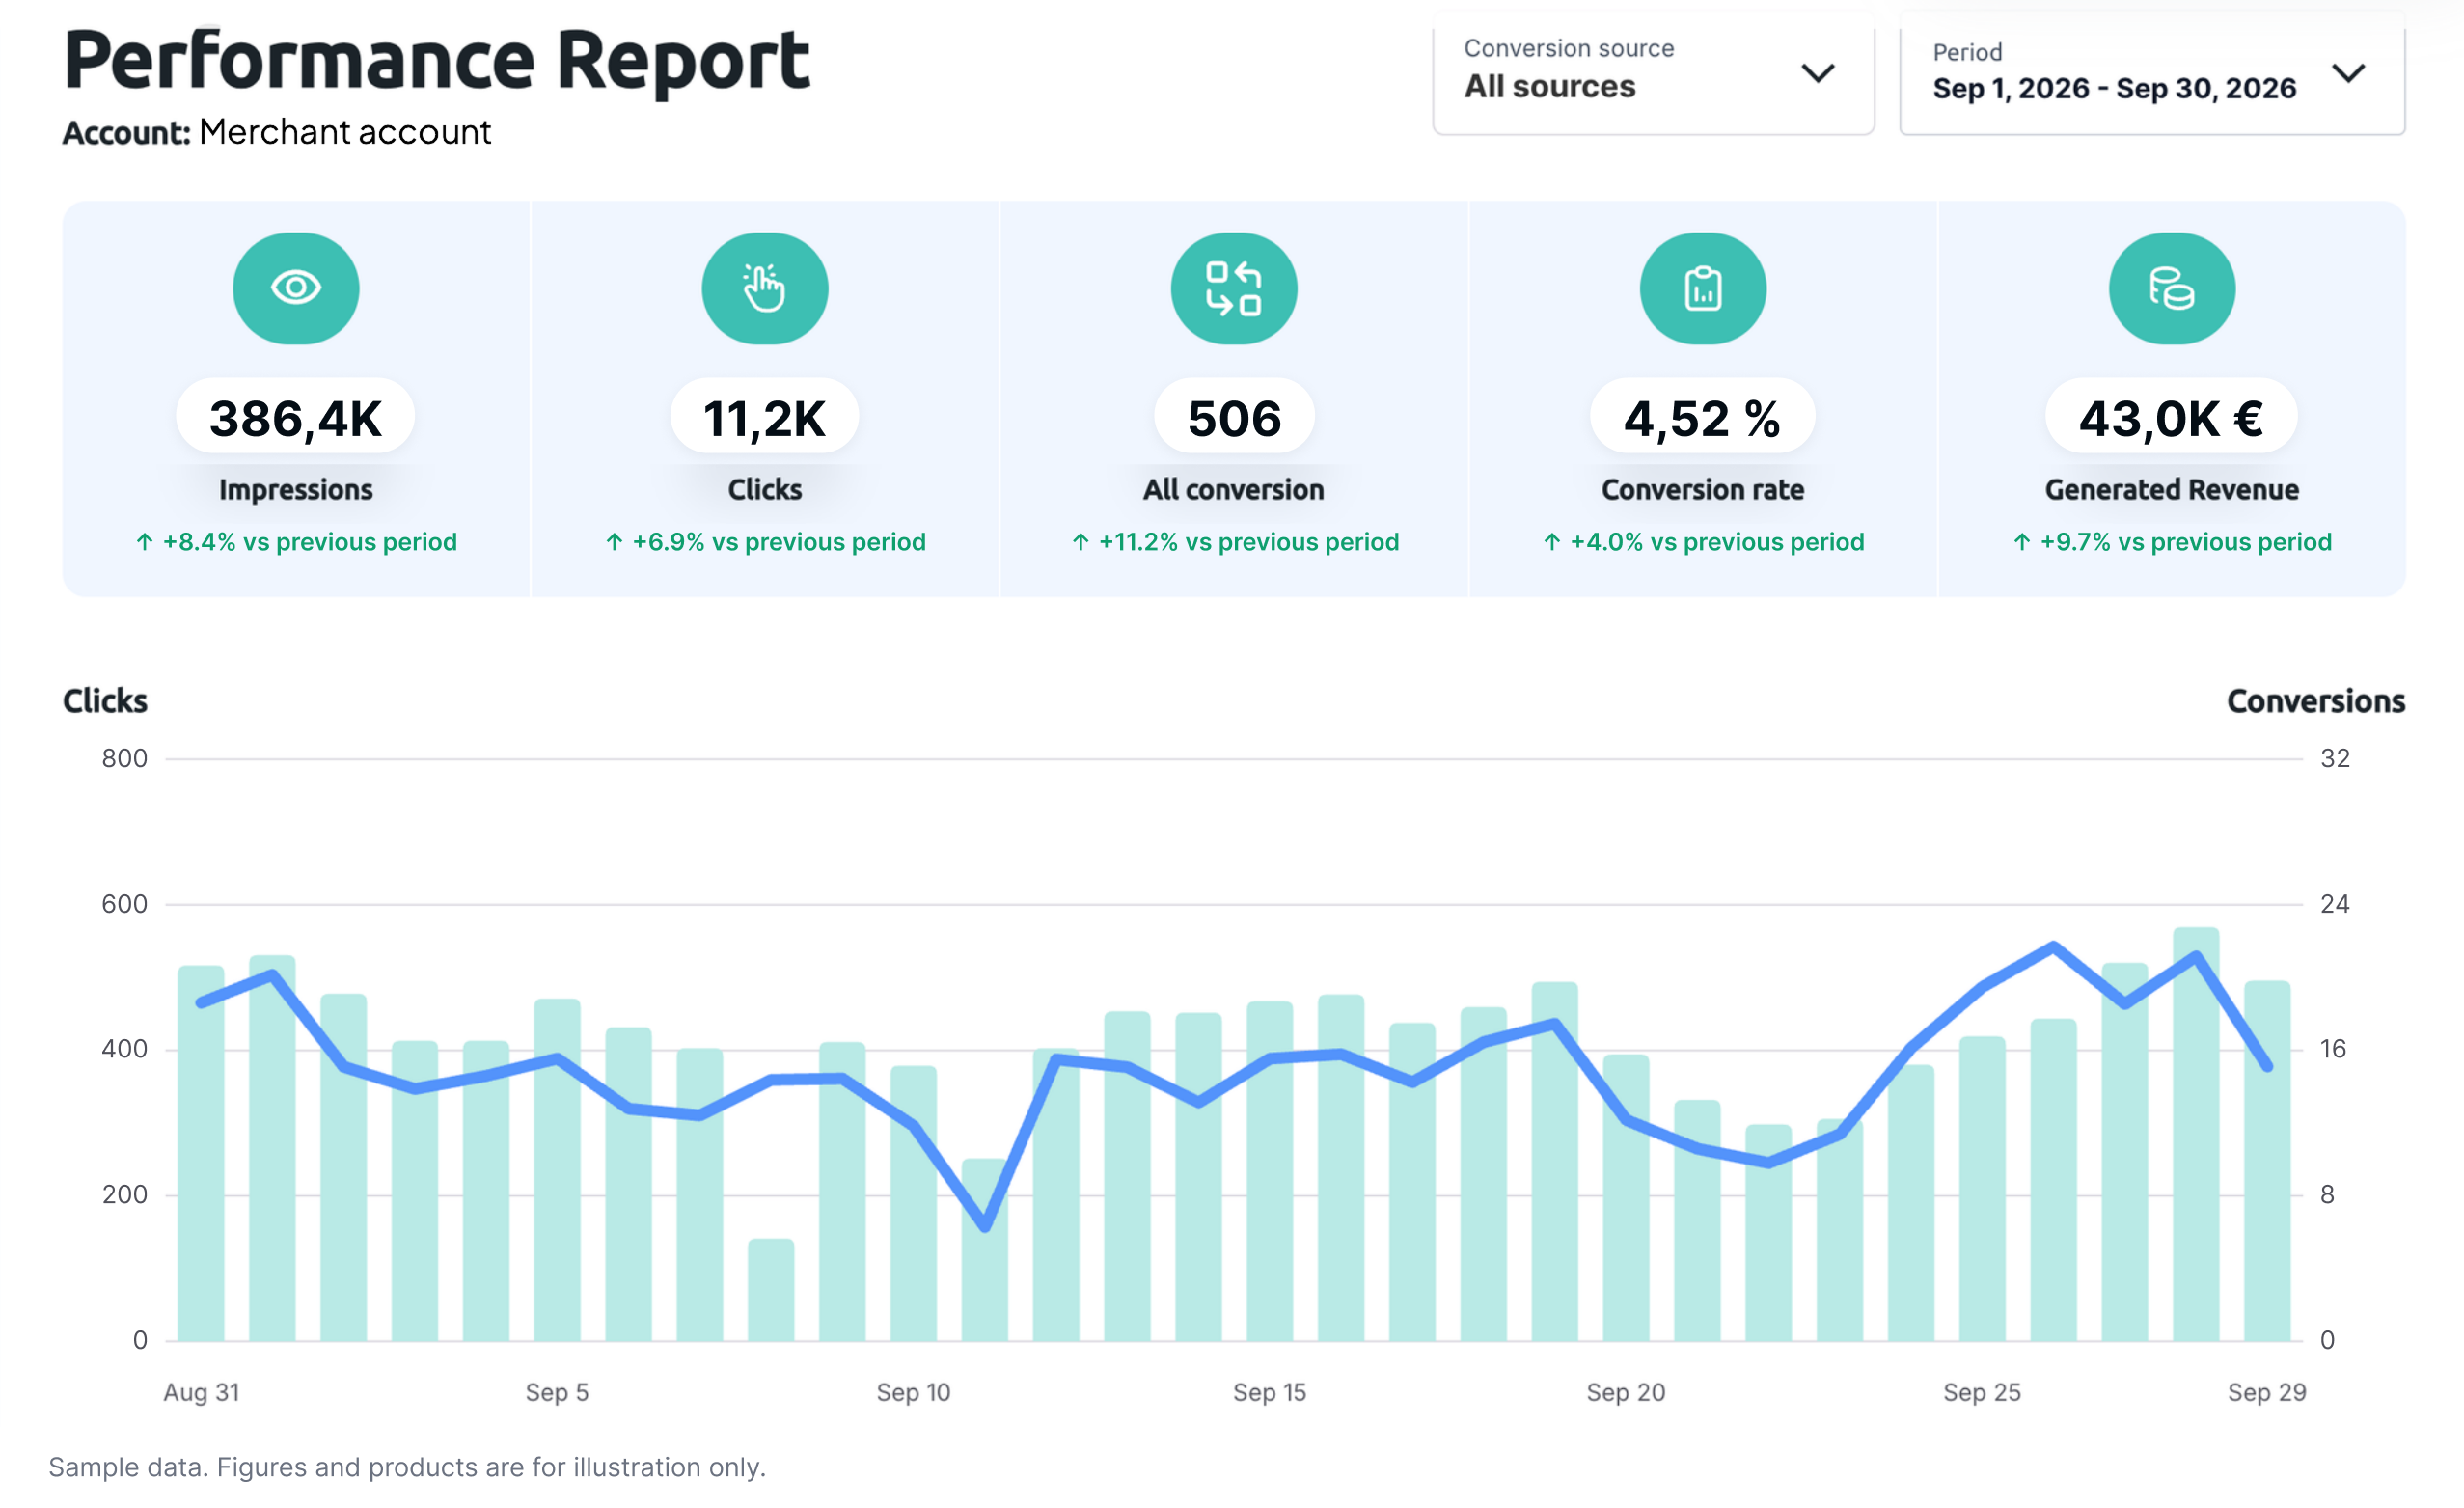
The performance report covers the channels your products run on
The report includes data on impressions, clicks, conversions, conversion rate and revenue from Google Shopping and Bing Shopping through Managed Ads, and from website listings on Shoparize.com. You can filter data by source, time period and country, compare it with previous periods, and export results for further analysis.
| Metric | What it shows |
|---|---|
| Impressions | Times your products were shown |
| Clicks | Shopper clicks through to your webshop |
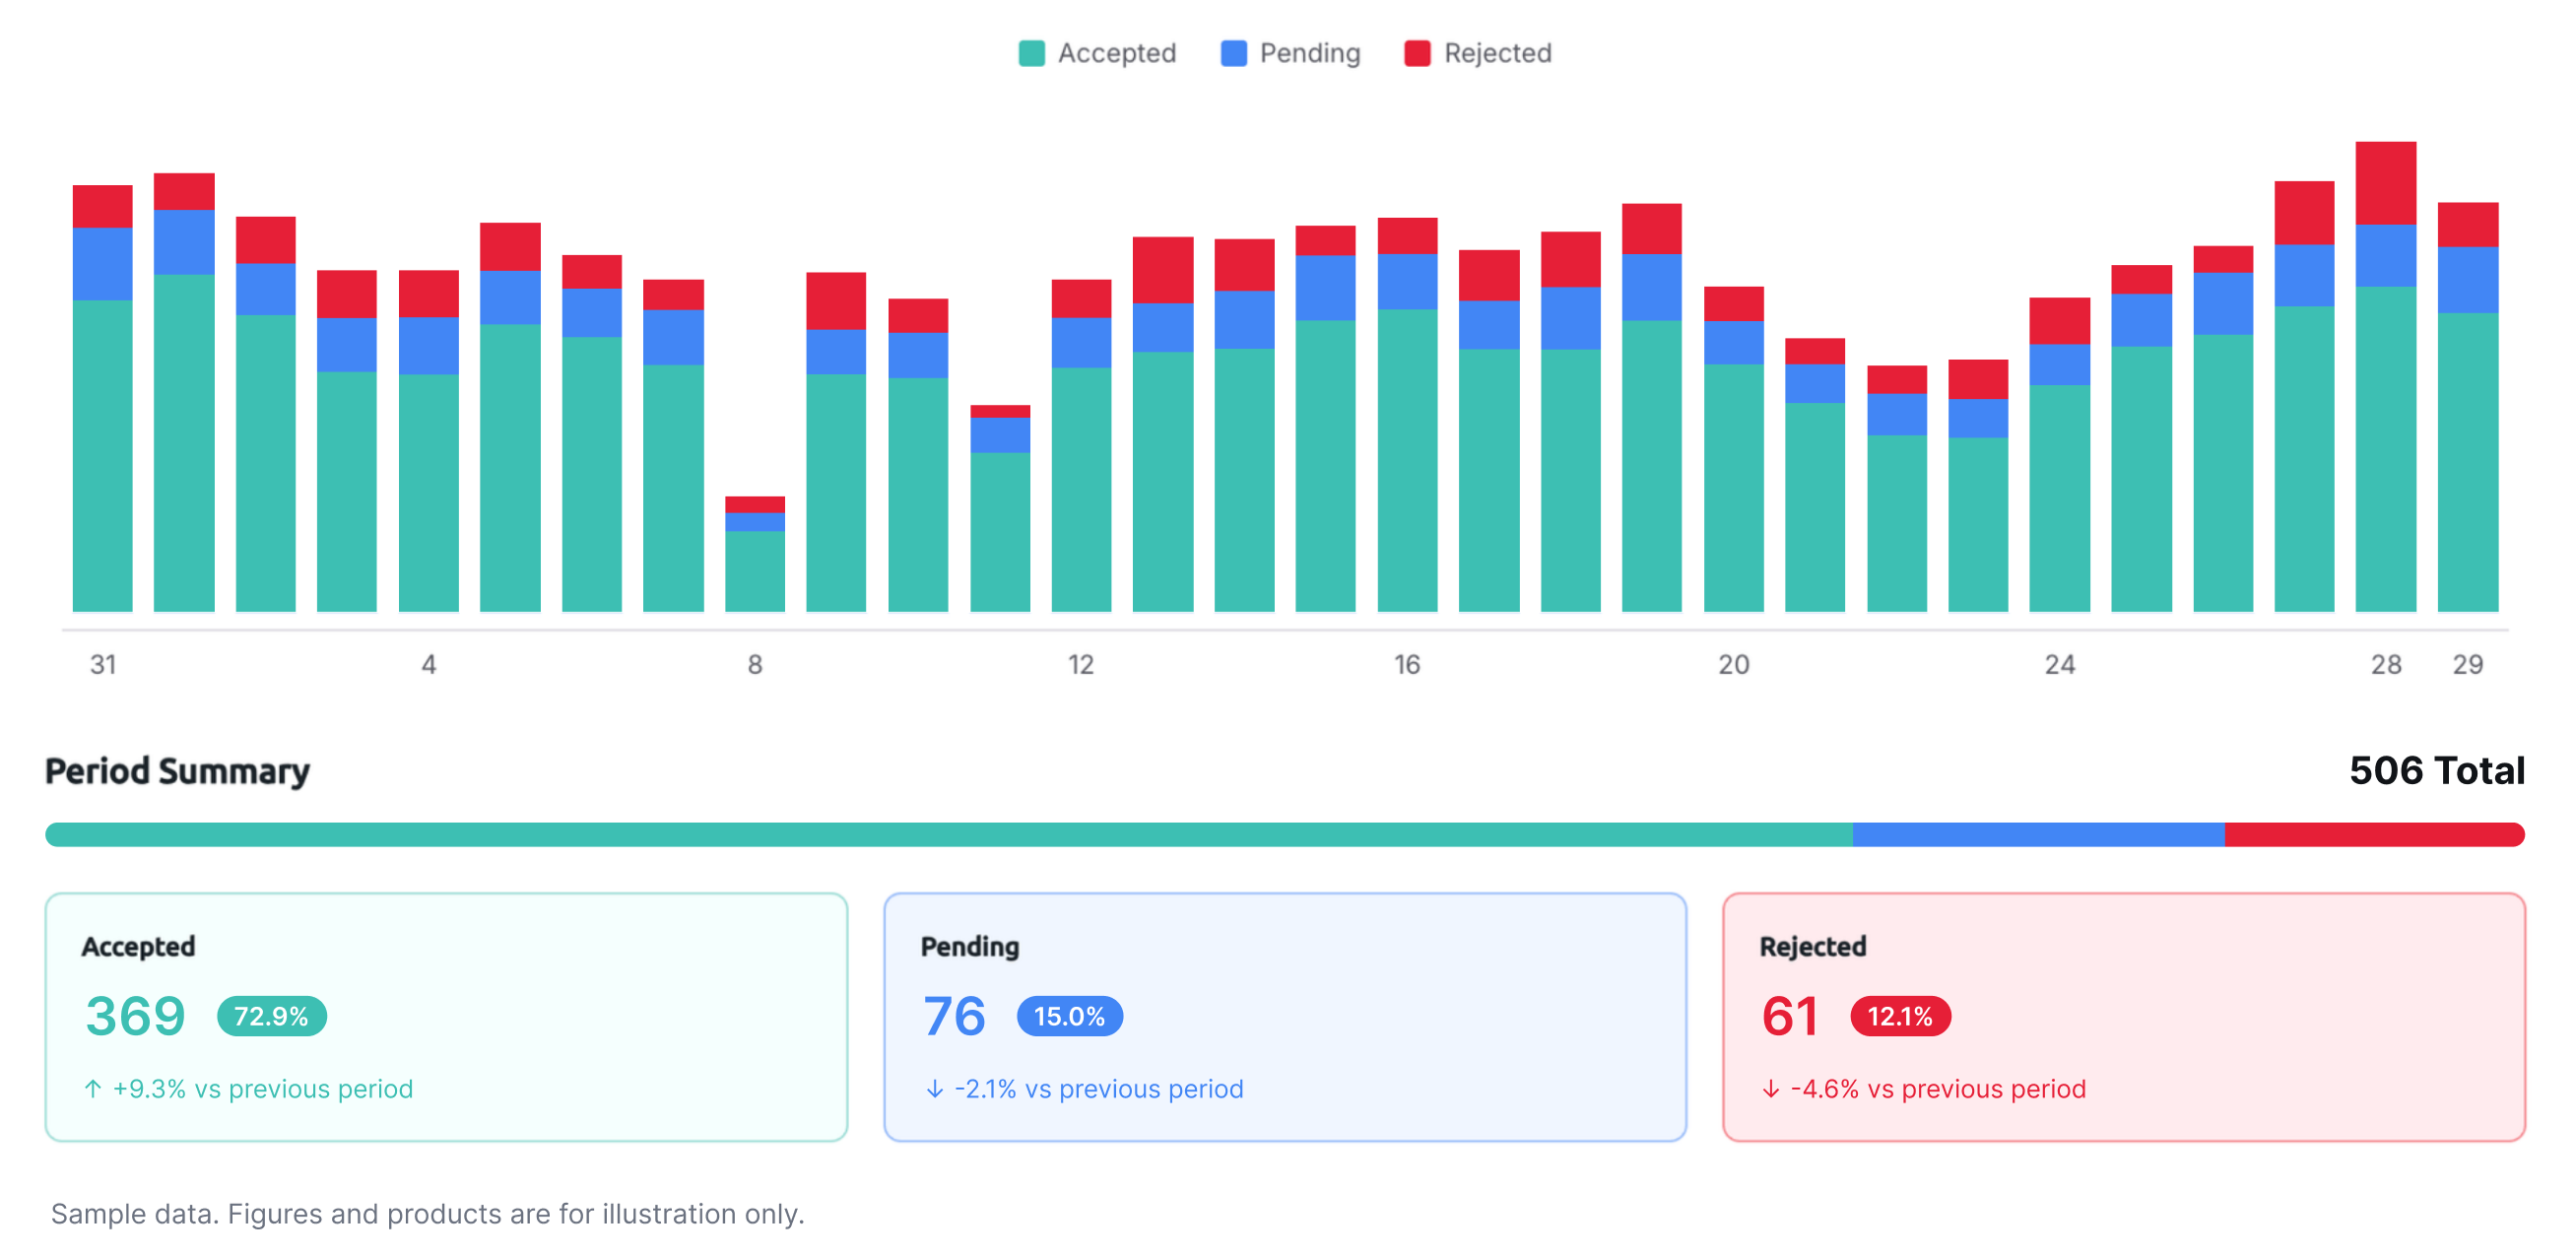
| Conversions | Orders attributed to Shoparize, marked as accepted, pending or rejected |
| Conversion rate | Conversions as a share of clicks |
| Revenue | Order value of attributed conversions |
Each conversion is labelled as accepted, pending or rejected, with period summaries showing totals for each status.
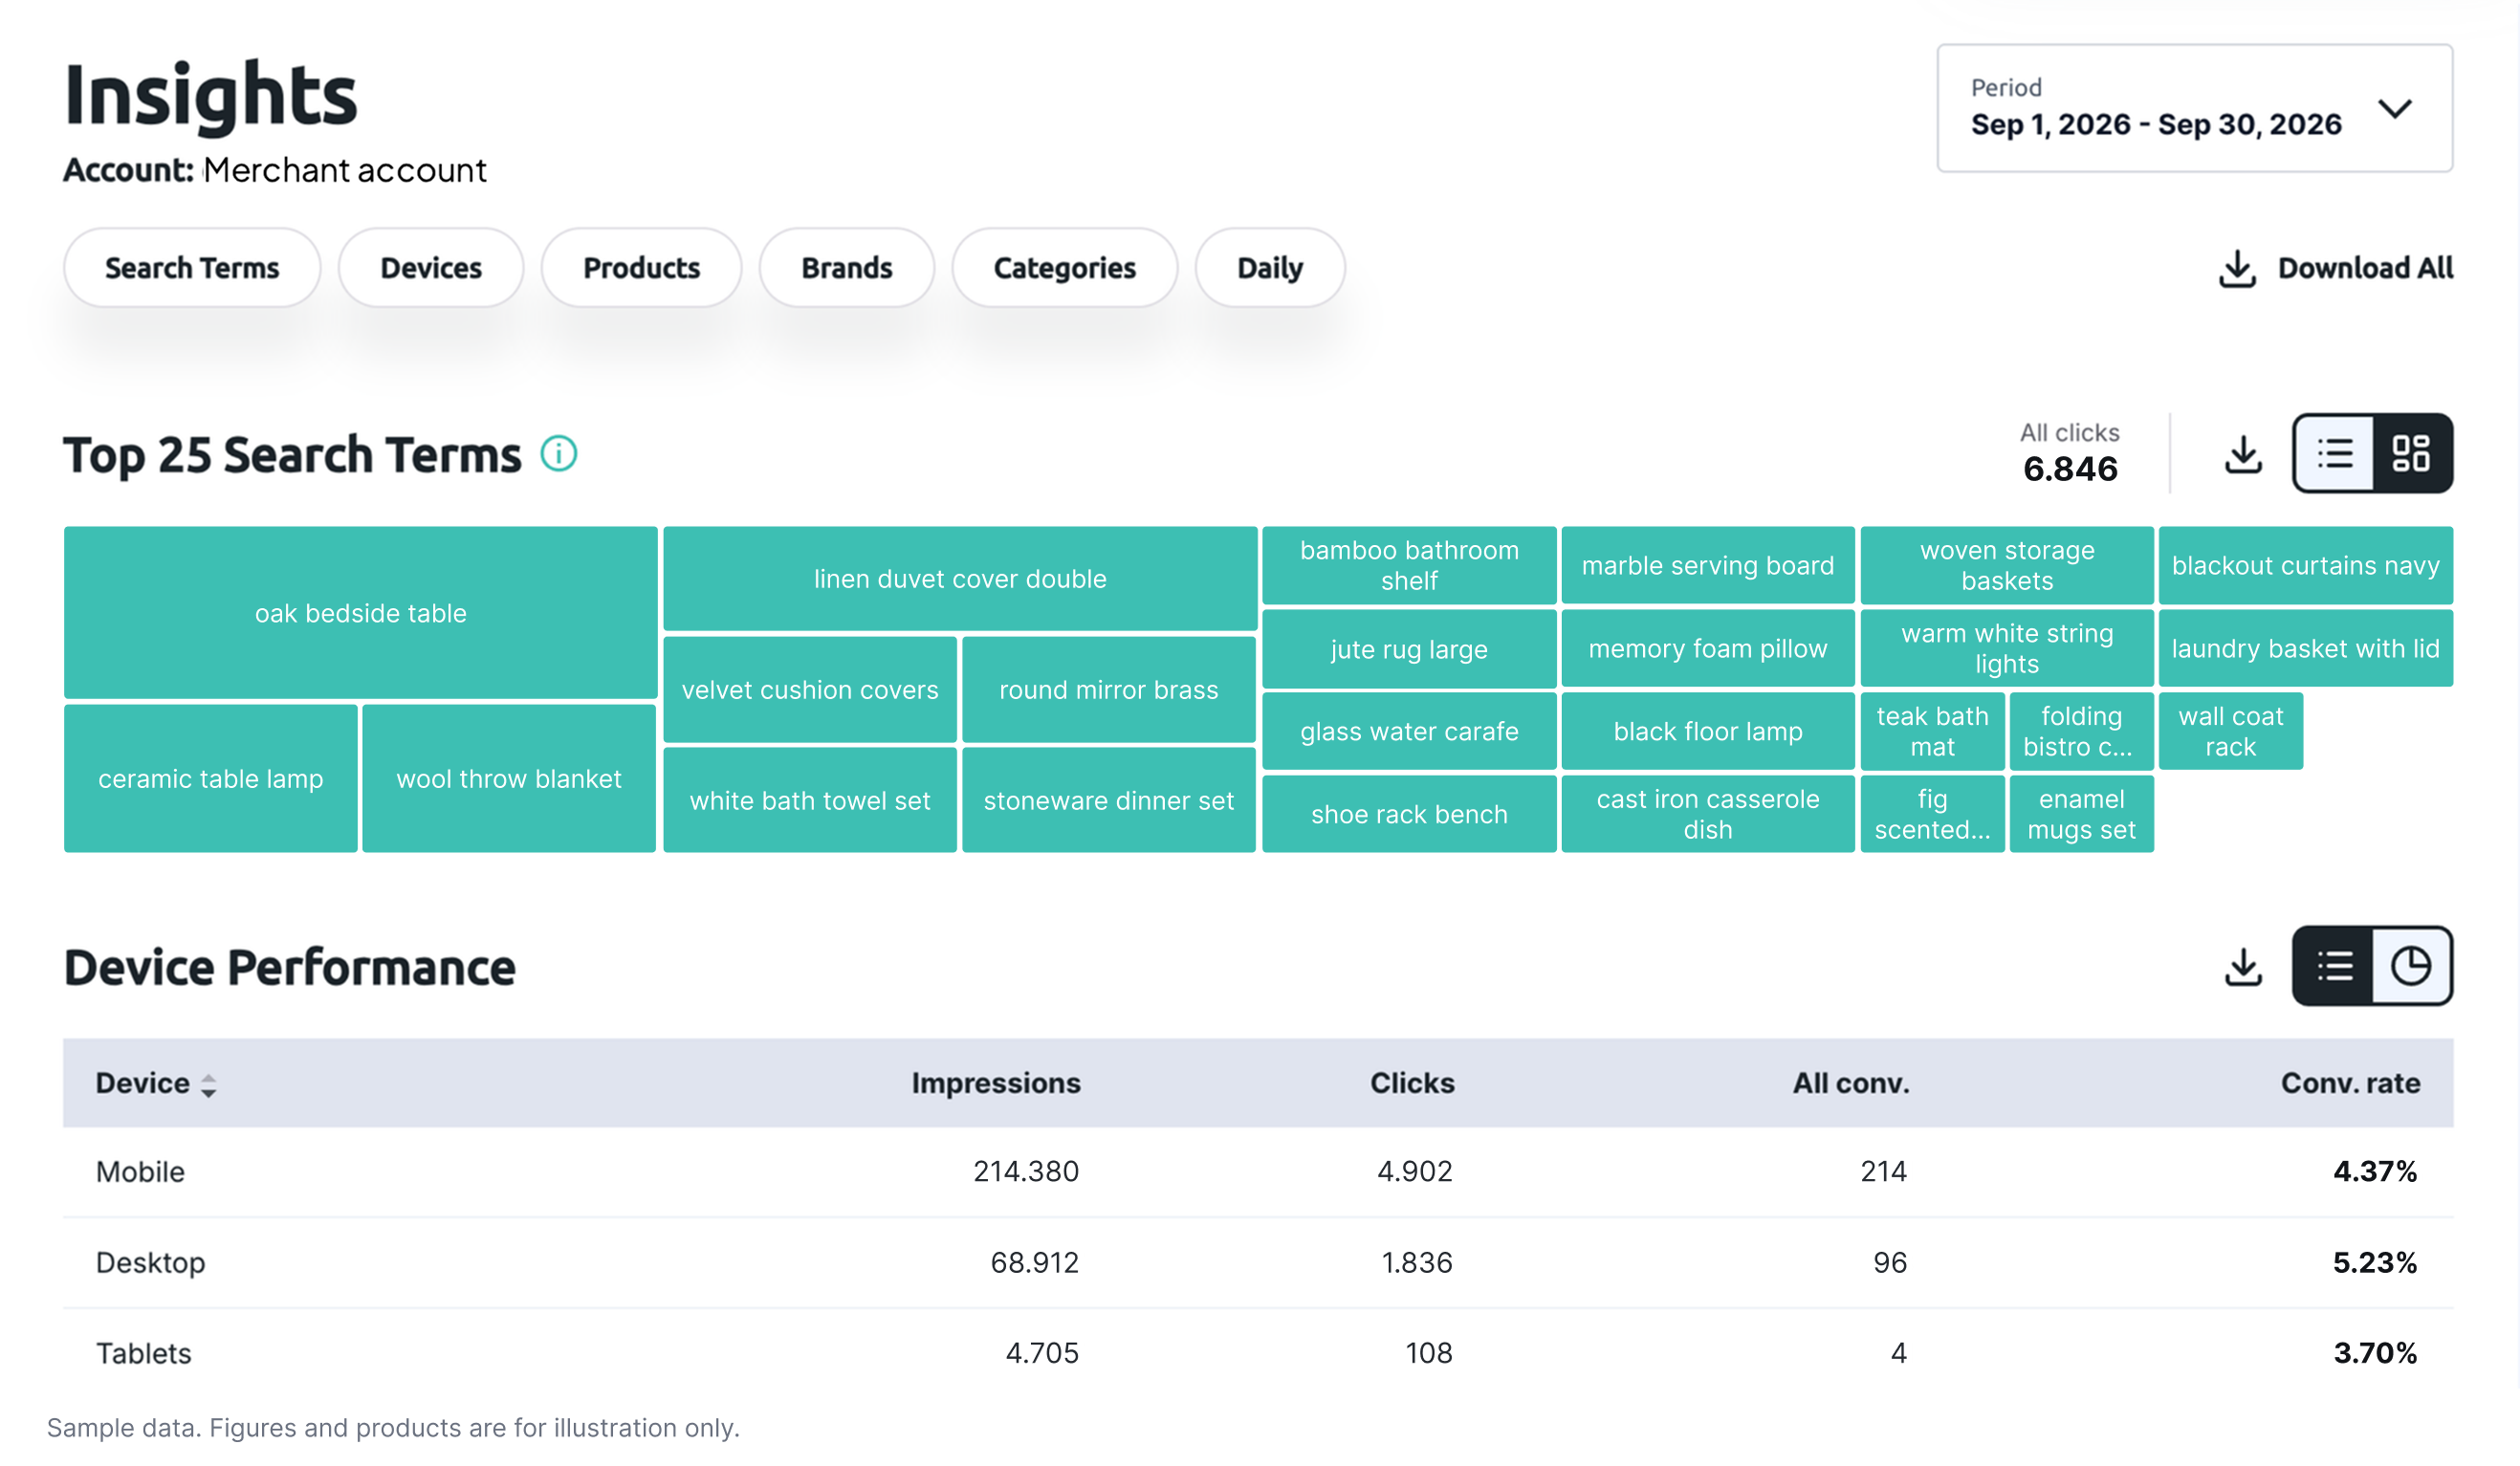
The insights page shows what shoppers search for and purchase on Google Shopping
The insights page breaks down your Google Shopping performance by search term, device, product, brand, category and day, starting with your top 25 search terms. See which products and brands are selling and which search terms drive traffic. You can download individual sections or export all data at once.
| Dimension | What it shows |
|---|---|
| Search terms | Your top 25 searches that led shoppers to your products |
| Devices | Impressions, clicks, conversions and conversion rate by mobile, desktop and tablet |
| Products | Your top-performing products |
| Brands | Performance by brand |
| Categories | Performance by product category |
| Daily | Performance by day |
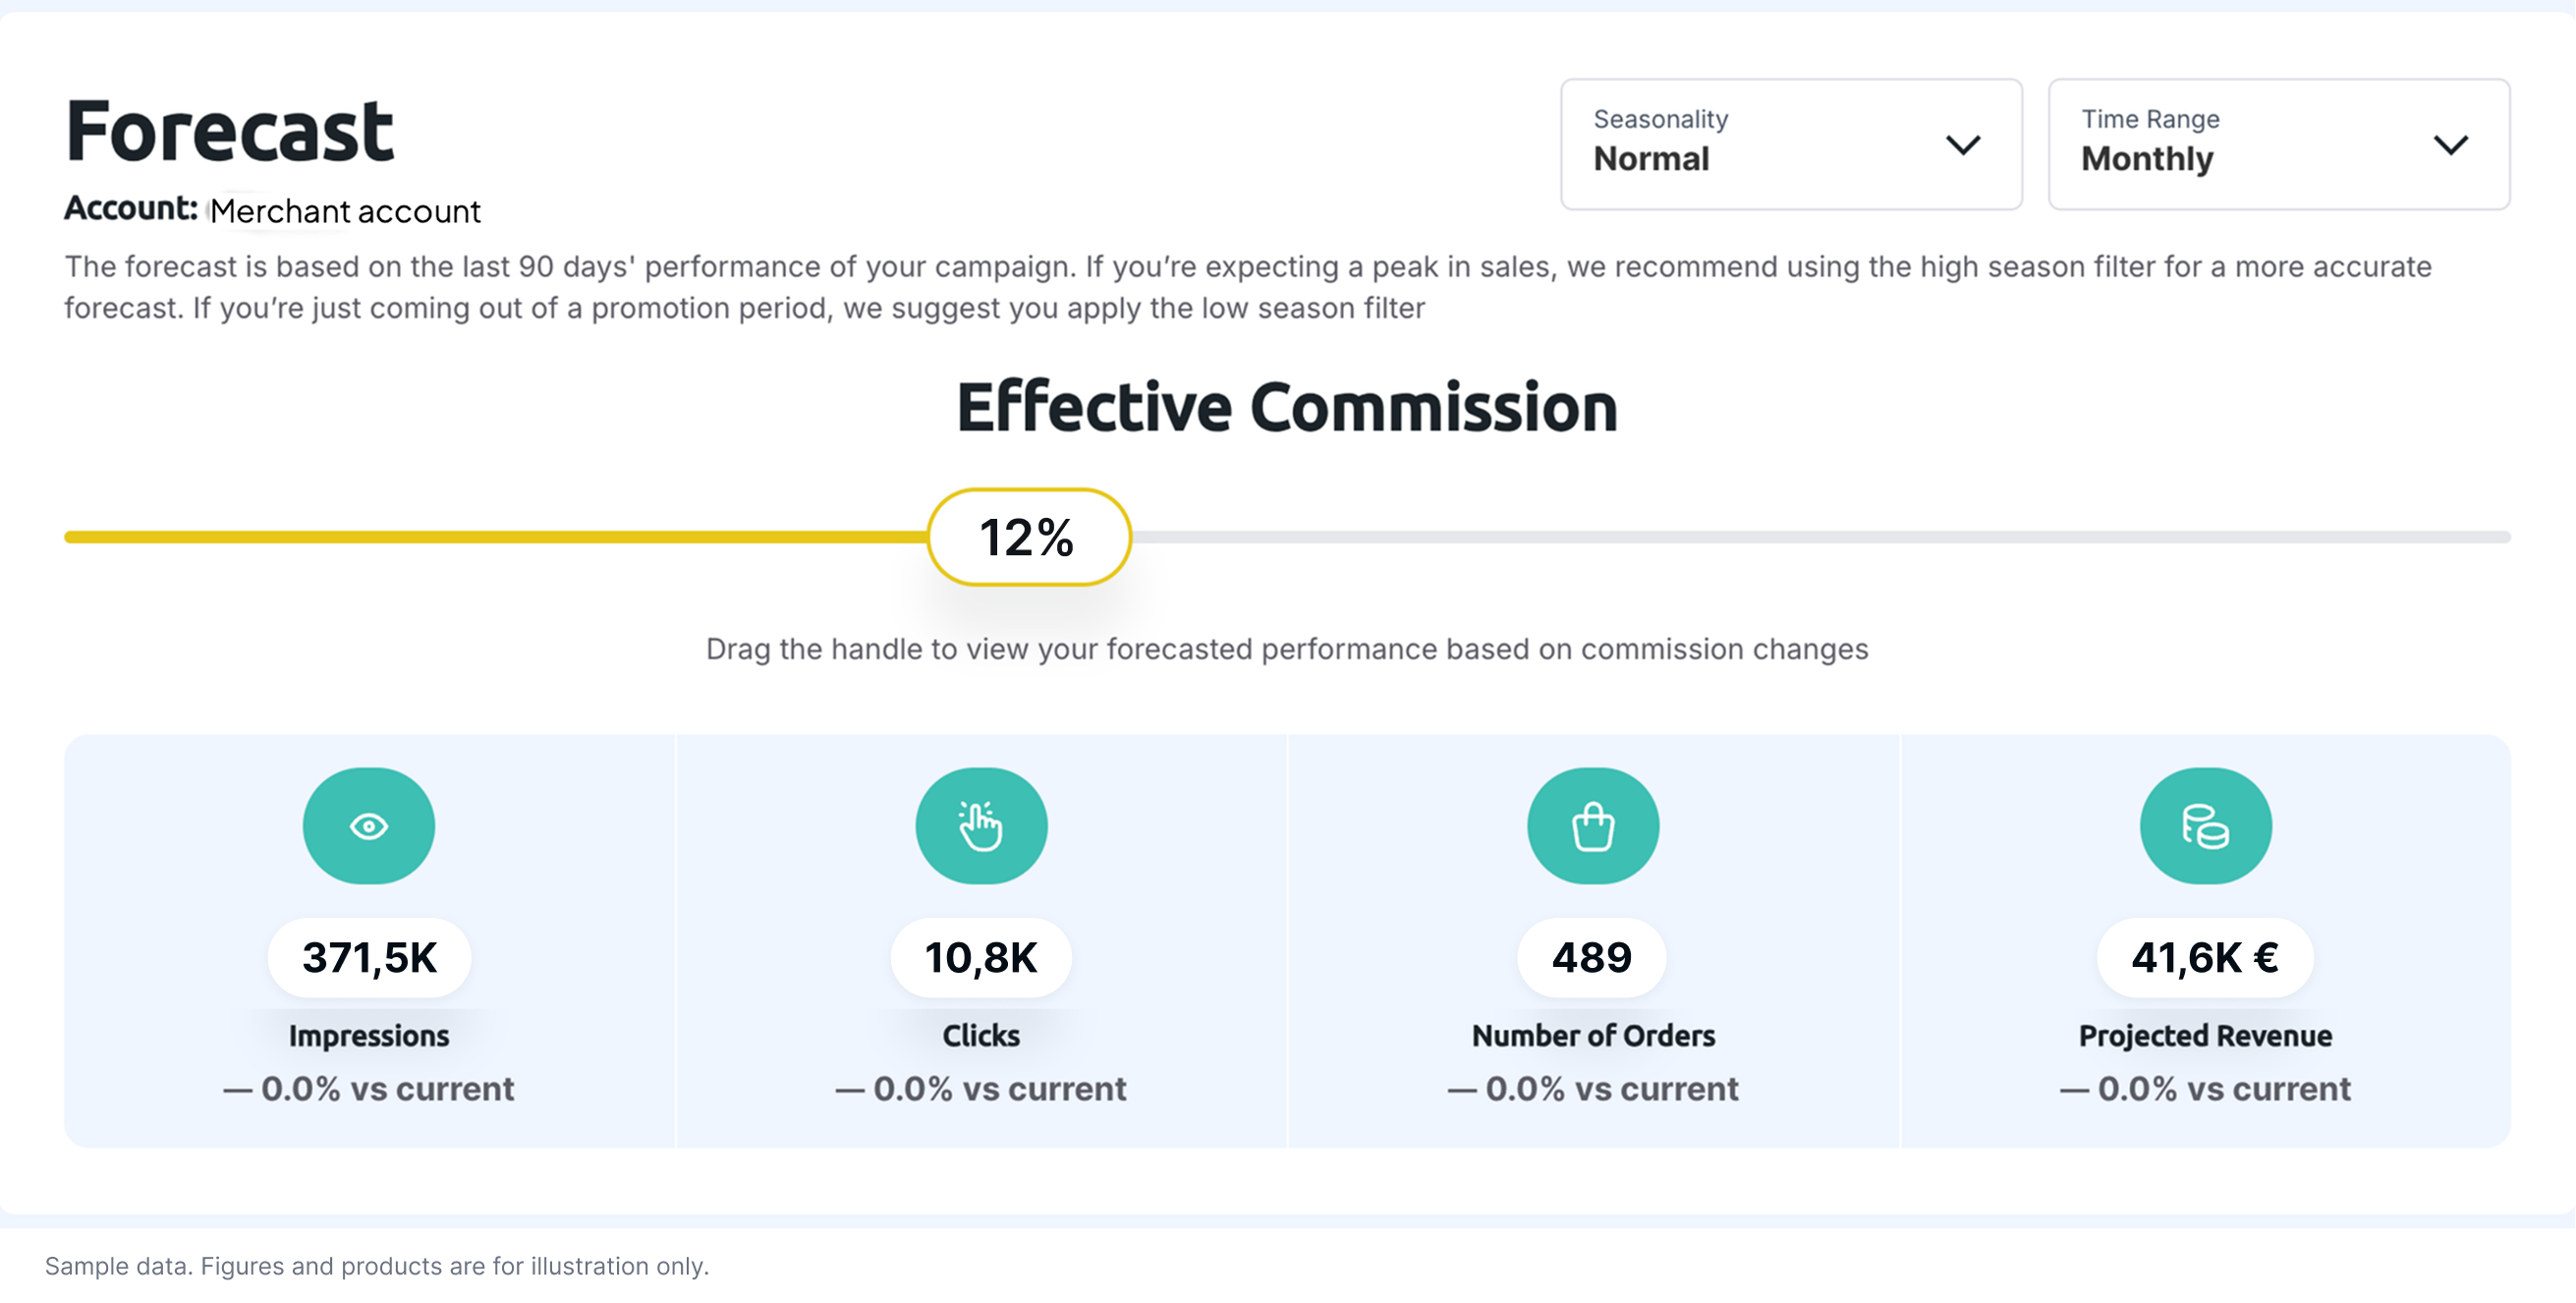
The forecasting tool projects the next week, month or year
The forecast estimates impressions, clicks, orders and revenue for the next 7, 30 or 365 days, based on your last 90 days of Google Shopping performance. It becomes available once you have 90 days of Managed Ads data. For a more accurate forecast, choose a seasonality setting: 'high season' if you expect a sales peak, such as Black Friday, or 'low season' if you are coming out of a promotion. Adjust the effective commission slider to see how commission changes affect your projections. Effective commission combines all category rates into one figure: total commission paid over the last 90 days divided by the total value of your sales.
Forecasts are estimates based on past performance and seasonality settings. They are not a guarantee of future performance.